The Four Numbers Every Business Should Be Graphing
Most business owners track something. A bank balance. A gut feeling about whether things are good or bad this month. Maybe a spreadsheet they update when they remember to.
Almost nobody tracks the right four numbers consistently, and that gap is a bigger problem than most people realize. About half of all small businesses do not make it past their fifth year, according to data from the Small Business Administration and the Bureau of Labor Statistics. A lot of that comes down to owners who could not see a problem early enough to fix it, because they were not watching the numbers that actually mattered.
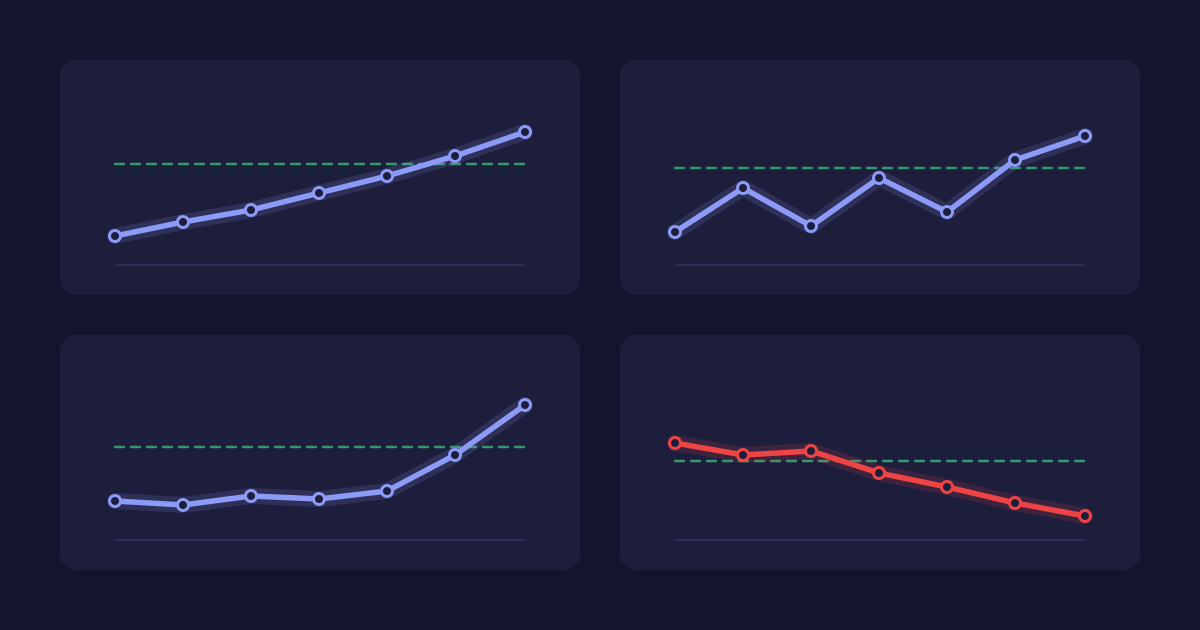
Here are the four that matter most, and why each one deserves its own graph, checked every single week.
One. Gross Income
This is the simplest one, and also the most important. Gross income is how much money you actually collected that week. Not invoiced. Not promised. Collected.
Think of gross income as the oxygen your business breathes. You can survive for a little while without it, the same way you can hold your breath for a minute or two, but everything else in the business runs on this number. Payroll runs on it. Inventory runs on it. Every other department depends on this number showing up consistently, because without it, nothing downstream gets funded.
This is also the number most directly tied to whether a business survives at all. If gross income is trending down for more than a few weeks in a row, that is not a random dip. That is a warning sign asking to be looked at now, while it is still small enough to fix.
Two. Sales
You cannot have gross income without sales. That sounds obvious, but here is the part people miss. Sales is not a department. Sales is an activity, and everyone in the organization should be doing some version of it.
If you are a one person operation, this means you need to allocate real time to selling, not just producing or delivering. If you have a sales team, each person should have their own individual sales graph, and there should also be one graph at the department level showing whether sales as a whole are moving up or holding steady or sliding.
Even if the money has not come in yet, sales activity should be tracked the moment it happens. A signed contract, a closed deal, a confirmed order, these should get logged and graphed right away, even if the actual cash collection lags behind by a few weeks. Sales tells you what is coming. Gross income tells you what already arrived. You need both graphs, because they answer different questions.
Three. Marketing
Not every business runs paid ads, and that is fine. But every business should be marketing in some form, whether that means organic content, referrals, local outreach, or a website that captures who you are and what you do.
Here is a number worth sitting with. According to the Small Business Administration, the average small business spends only about 1 percent of its revenue on advertising. And according to Constant Contact's 2025 research, just 18 percent of small business owners feel confident their marketing is actually working, down from 27 percent the year before.
Read that again. Most business owners are not confident their marketing works, and a huge percentage of them are not measuring it closely enough to actually find out. That is not a marketing problem. That is a tracking problem.
What you graph here depends on your business. It might be leads generated. It might be website visits. It might be social media reach or video views or email signups. The specific number is less important than picking one and watching it every week. If you are not sure your marketing is working, the fix is rarely spending more. It is measuring what you already have.
Four. Delivery
This is the number most businesses skip entirely, and it is the one that keeps you honest about whether you can actually deliver what you sold.
Delivery looks different depending on what you do, and it is worth being careful not to accidentally duplicate your sales number here. If you sell physical products, delivery might be how many packages actually shipped out this week, not how many units you sold. Those are two different numbers. You can sell a hundred units and only ship sixty if your fulfillment is falling behind, and that gap is exactly what this graph is meant to catch.
If you are in a service business, delivery might be the value of services actually completed. A tax preparer charging a flat rate per return could track the number of returns filed each week. Someone offering several different services at different price points might track total dollar value of work delivered instead, since a simple headcount would not capture the different sizes of each job.
The point of this graph is simple. Selling something and delivering it are not the same event; and a business that sells faster than it can deliver is building a problem for itself, one that shows up as unhappy customers long before it shows up in the financials.
Why These Four, Together
Look at what these four numbers actually cover once you put them side by side.
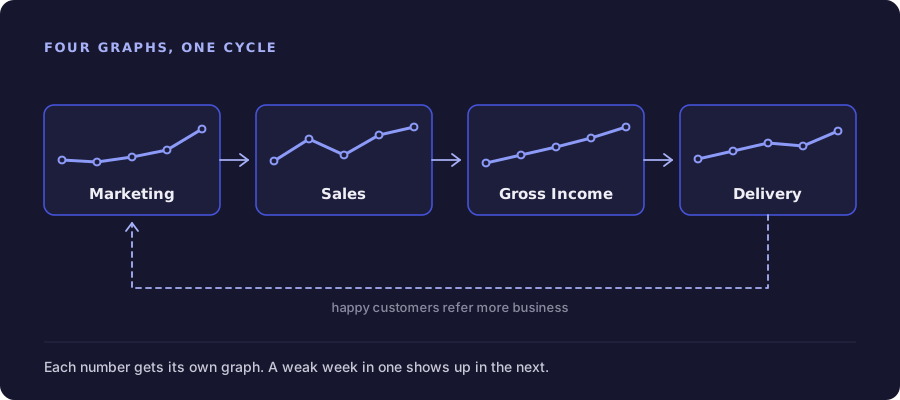
Marketing feeds sales. Sales feeds gross income. Gross income funds delivery. Delivery is what keeps the customers happy enough to refer more business, which feeds marketing right back at the start. It is a loop, not four separate departments living in isolation.
Track all four on a weekly basis, on a simple line graph, and you have a complete picture of whether your business is actually healthy, not just whether the bank account happens to look fine this particular week.
Start This Week
You do not need four dashboards or four different tools to do this. You need four line graphs, checked every week, on the same day, so you build the habit of actually looking.
MarkMyGraph was built for exactly this. Set up your gross income, sales, marketing, and delivery graphs in minutes, and start seeing the full loop of your business instead of just one piece of it.